Docker, a popular containerization platform, provides an excellent solution for distributing and managing software applications quickly. Docker Compose, a powerful tool, is used to orchestrate the simultaneous operation of multiple containers.
Elasticsearch is a robust search and analytics engine with powerful capabilities for indexing, querying, and analyzing data. Kibana, an open-source tool, complements Elasticsearch by offering a platform to visualize and comprehend data stored within Elasticsearch.
Let’s create a project to gain a better understanding of it.
1. Create a Spring Boot Project
To get started, let’s create a new Spring Boot project using Spring Initializr.
2. Add dependencies
dependencies {
    implementation 'org.springframework.boot:spring-boot-starter-web'
    testImplementation 'org.springframework.boot:spring-boot-starter-test'
    implementation 'org.springframework.boot:spring-boot-starter-data-elasticsearch:3.2.1'
    compileOnly 'org.projectlombok:lombok'
    annotationProcessor 'org.projectlombok:lombok'
}
3. docker-compose.yaml
This Docker Compose file provides some configuration options and resource constraints for both services.
version: '3'

services:
  elasticsearch:
    container_name: elasticsearch
    image: docker.elastic.co/elasticsearch/elasticsearch:8.10.4
    environment:
      - CLI_JAVA_OPTS=-Xms2g -Xmx2g
      - bootstrap.memory_lock=true
      - discovery.type=single-node
      - xpack.security.enabled=false
      - xpack.security.enrollment.enabled=false
    ports:
      - 9200:9200
    networks:
      - elastic
    deploy:
      resources:
        limits:
          cpus: '2.0'
        reservations:
          cpus: '1.0'

  kibana:
    image: docker.elastic.co/kibana/kibana:8.10.4
    container_name: kibana
    environment:
      XPACK_ENCRYPTEDSAVEDOBJECTS_ENCRYPTIONKEY: ${ENCRYPTION_KEY}
    ports:
      - 5601:5601
    networks:
      - elastic
    deploy:
      resources:
        limits:
          cpus: '2.0'
        reservations:
          cpus: '1.0'

networks:
  elastic:
    driver: bridge
Descriptions of the fields:
container_name: The name of the Elasticsearch and Kibana container.
image: The Docker image to be used for Elasticsearch and Kibana with version 8.10.4.
environment: Sets environment variables for Elasticsearch and Kibana.
ports: Maps the Elasticsearch service’s port 9200 , Kibana service’s port 5601 from the container to the host.
networks:Connects the container to the custom network named elastic.
deploy: Specifies deployment-related configurations, such as CPU limits(maximum) and reservations(minimum).
Note: CPU limits depend on various factors such as the application’s requirements, usage scenarios, and other processes running on the host system.
Defines a custom network named elastic that both Elasticsearch and Kibana services are connected to.
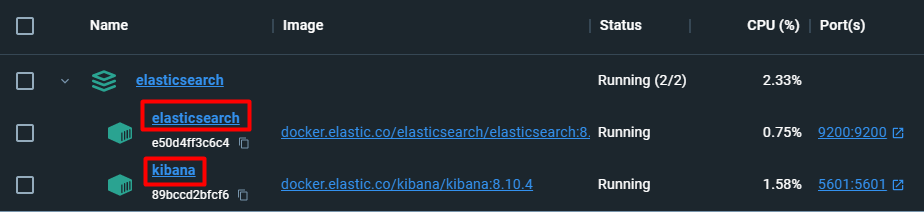
4. docker compose up command
The docker-compose up command is used to start and run the services defined in your Docker Compose configuration. This command reads the specified docker-compose.yaml file, creates and starts Docker containers based on the defined services and configurations.
docker-compose up
If you are using a different file name and it’s not named docker-compose.yaml, you can specify it with the -f or --file parameter:
docker-compose -f your-compose-file.yaml up
To stop the containers and clean up resources, you can use the docker-compose down command:
docker-compose down
When Elasticsearch is running on Docker, we expect to encounter the following output when we navigate to http://localhost:9200.
{
  "name" : "e50d4ff3c6c4",
  "cluster_name" : "docker-cluster",
  "cluster_uuid" : "UQw-WSBHRbS4xblWP28JEQ",
  "version" : {
    "number" : "8.10.4",
    "build_flavor" : "default",
    "build_type" : "docker",
    "build_hash" : "b4a62ac808e886ff032700c391f45f1408b2538c",
    "build_date" : "2023-10-11T22:04:35.506990650Z",
    "build_snapshot" : false,
    "lucene_version" : "9.7.0",
    "minimum_wire_compatibility_version" : "7.17.0",
    "minimum_index_compatibility_version" : "7.0.0"
  },
  "tagline" : "You Know, for Search"
}
5. application.yaml
If you do not specify any configuration, Spring Boot automatically uses the default connection information and attempts to connect to Elasticsearch at http://localhost:9200.
6. Create Entity, Repository, Service and Controller
package com.ayseozcan;

import lombok.*;
import org.springframework.data.annotation.Id;
import org.springframework.data.elasticsearch.annotations.Document;
import org.springframework.data.elasticsearch.annotations.Field;
import org.springframework.data.elasticsearch.annotations.FieldType;

@AllArgsConstructor
@NoArgsConstructor
@Data
@Builder
@Document(indexName = "drugs")
public class Drug {
    @Id
    private String id;
    @Field(type = FieldType.Text)
    private String brand;
    @Field(type = FieldType.Text)
    private String company;
    @Field(type = FieldType.Integer)
    private Integer stock;
}
@Document(indexName = "drugs"): This annotation indicates that the class is an Elasticsearch document. The indexName parameter specifies to which Elasticsearch index the document belongs. In this example, the index name is set to “drugs.”
@Field: This annotation specifies the properties of a particular field within the Elasticsearch index. The type parameter indicates the type of the field. For instance, FieldType.Text represents a text-type field, and FieldType.Integer represents an integer-type field.
package com.ayseozcan;

import org.springframework.data.elasticsearch.repository.ElasticsearchRepository;
import org.springframework.stereotype.Repository;

@Repository
public interface IDrugRepository extends ElasticsearchRepository<Drug,String> {
}
ElasticsearchRepository interface, which is a part of the Spring Data Elasticsearch framework. It enables the performing of CRUD (Create, Read, Update, Delete) operations and searching on Elasticsearch indices.
After creating the Service and Controller classes, let’s run our project.
Completing the save operations, let’s take a look at using Kibana to view and visualize the data.
7. To access the Kibana interface, go to http://localhost:5601.
From there, navigate to the Discover section in the toolbar on the left.
Click on Create data view and create an Index pattern.
You can view all the data you have saved on the Discover screen.

Head back to the toolbar and click on the Dashboard section.
You can create a dashboard and visualize your data by clicking on Create visualization and choosing a visualization type.
By following these steps, you’ll be able to interactively visualize and analyze your saved data using Kibana.
(You can access the full code from my GitHub account)
References:
https://www.elastic.co/blog/getting-started-with-the-elastic-stack-and-docker-compose
https://www.elastic.co/guide/en/elasticsearch/reference/8.11/docker.html
https://www.elastic.co/guide/en/elasticsearch/reference/current/elasticsearch-intro.html
https://docs.spring.io/spring-data/elasticsearch/reference/elasticsearch/repositories/elasticsearch-repositories.html
https://docs.spring.io/spring-data/elasticsearch/reference/elasticsearch/versions.html#_footnotedef_1
https://mvnrepository.com/artifact/org.springframework.boot/spring-boot-starter-data-elasticsearch/3.2.1
https://www.elastic.co/guide/en/kibana/current/introduction.html
https://www.elastic.co/guide/en/kibana/current/dashboard.html
https://www.elastic.co/guide/en/kibana/current/data-views.html
https://www.elastic.co/guide/en/kibana/current/create-a-dashboard-of-panels-with-web-server-data.html
